Author: Andrés Rieznik
Senior Researcher
![]() @AndresRieznik
@AndresRieznik
DeFi's growing pains: As TVL rises, so does the probability of being hacked


We estimate that when a DeFi increases its TVL by a factor of 10, its probability of being hacked increases by 10% or 13%, depending on the data considered for the analysis.
Abstract: We explore empirical evidence on the risk associated with DeFi protocols, that is, the risk of cyberattacks in the form of hacking incidents, rug pulls or economic attacks as a function of the TVLs of the protocols.
Using a list of 98 cyberattacks since 2020, provided by rekt.news website, an established source of anonymous authors performing investigative journalism and incident analyses, and the data provided by defillama.com, the fully open source and largest TVL aggregator for DeFi, we found that the probability of a DeFi protocol being hacked increases linearly with the logarithm base 10 of its TVL.
Introduction
Blockchain-based Decentralized Finance (DeFi) protocols use smart contracts to create a solely code-based, intermediary-independent financial system that can reduce transaction costs and generate distributed trust. Since its appearance more than 10 years ago, DeFi has grown in assets locked to hundreds billions of dollars.
From a security standpoint, the first quarter of 2022 was the darkest quarter in DeFi history. DeFi hacks have led to a total loss of $1.2 billion, which represents an increase of 695% from the 2021 Q1 losses of $154.6 million [Uno.Reinsure, 2022]. According to Chainalysis [Chainalysis, 2022], almost 97% of all cryptocurrency stolen in the first three months of 2022 has been taken from DeFi protocols, up from 72% in 2021 and just 30% in 2020.
As with other aspects of DeFi research, there is a growing literature specifically on DeFi security (See [Zhou, 2002] for a review ). In this paper we explore empirical evidence on the risk associated with DeFi protocols, that is, the risk of cyberattacks in the form of hacking incidents, rug pulls or economic attacks, as a function of its Total Value Locked (TVL). To the best of our knowledge this is the first time this estimation is calculated, although all data were collected from public sources.
The TVL is defined as the total value of cryptocurrency locked in a DeFi smart contract, given in United States dollar or any fiat currency. TVL in staking protocols, for instance, represents the amount of assets deposited by the liquidity providers in that DeFi. Although limited, because of different conditions that may affect and vary it, TVL is a popular indicator among DeFi investors to assess the overall value of assets deposited in a DeFi project.
DeFi protocols with larger TVLs will naturally be more attacked, but they also have a larger budget to invest in cybersecurity and audits. So, a natural question arises: which one of these two forces wins? The one with the larger amount of attacks, or the one done with the investments decided by DeFi administrators?
In other words, are DeFi projects with larger TVLs less or more likely to be hacked than protocols with smaller values? In this article, we aim to answer this question by empirically estimating the probability distribution that a DeFi will be hacked as a function of its TVL market share, i.e., as a function of the portion that its TVL represents compared to the total TVL adding the TVL of all existing DeFi protocols. In the next section we describe our methods to obtain and analyze this data, and in the following sections we present and discuss the results.
Methods
The list of existing DeFi projects and its TVLs can be found in defillama.com, (see https://defillama.com/about). Today, August 8th, 1504 DeFi projects are listed. We downloaded this data using the unofficial Defillama client for python.
Also, an exhaustive list of DeFi protocols hacks and stolen values since 2020 can be found in rekt.news, which serves as a public platform for anonymous authors performing investigative journalism and incident analyses, where 98 incidents are listed to this day (August 8th).
It is more difficult to find the DeFi projects TVLs at the moment of their hacks. In many cases, but not all, this info can be found in defillama.com or in stelareum.io. Performing additional searches on the web, we managed to collect the data for 50 of the 98 hacks listed in rekt.news. The list with the DeFi names, stolen values, and TVLs at the moment of the hack can be found in this google drive, where we also cite the references from which we collected each data point. We checked that the 50 data points are not biased towards the largest DeFi protocols.
With this data we estimated the probability distribution that a DeFi will be hacked as a function of its TVL market share by simply dividing the number of DeFi protocols with TVLs within a given interval that had been hacked by the total number of DeFi protocols with TVLs in the same interval. Since the hacks occurred at different moments, we estimated what would be the TVL of the DeFi today given its market share at the day of the incident and assuming the same market share today. To do so, we multiplied the TVL value of the DeFi on the day of the incident by the total TVL adding all DeFi protocols TVLs today (August 8th), and then divide it by the total TVL adding all DeFi protocols TVLs on the day of the incident (the total TVL adding all DeFi protocols each day since 2020 can also be downloaded from defillama.com).
We performed an additional analysis in order to check the robustness of the obtained results: by analyzing the relationship between the TVL on the day of the incident and the stolen amounts for the 50 incidents for which we do have the data, we can estimate the TVL on the day of the incident for the 48 DeFi protocols for which we don't have the TVL on the day of the incident but we do have the stolen amount, which are listed in rekt news. As showed in the Results section, for the 50 incidents for which we do have the full data there is a significant linear relation in log-log scale between the TVL on the day of the incident and the stolen amount, which enables us to estimate the TVL on the day of the incident for the 48 incidents for which we don't have this data but we do have the stolen amount. We can then compare the probabilities of being hacked as a function of the TVL only considering the 50 incidents for which we do have the full data or the same probabilities considering all 98 incidents.
To analyze the data we ran simple linear regression models using the probability of being hacked as the dependent variable and the updated TLVs (given its market share at the moment of the hack) as the independent variable.
Results
In Figure 1 we show two superimposed histograms. In blue, the number of DeFi protocols with TVLs in a given interval today (August 8th). The TVL values are expressed in US dollars in log10 scale, so, for instance, the value 6 in the horizontal axis represents one million dollars, and the value 7 ten million. We use a step-size of 0.4 (we discuss the criteria for this choice ahead). In orange, we show the number of DeFi protocols within a given TVL interval that had been hacked. The TVL of the hacked DeFi protocols were updated to represent the value they would have today given its market share at the moment of the incident, as explained in the Methods section.
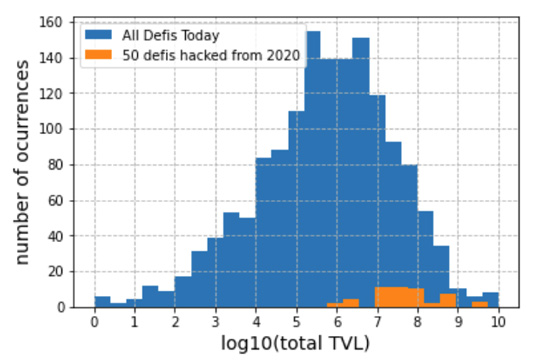
Figure 1: (blue) histogram of the number of DeFi protocols with different TVL values (in US dollars) that exists today, August 8th; (orange) number of DeFi protocols with different TVL values, updated according to its market share at the moment of the incident and assuming the same market share today, that had been hacked.
We attribute the fact that no orange bars appear for TVL values smaller than one million dollars to the fact that hacks of smaller DeFi protocols do not appear in rekt news. So in Figure 2 we zoom in on the right side of the histogram.
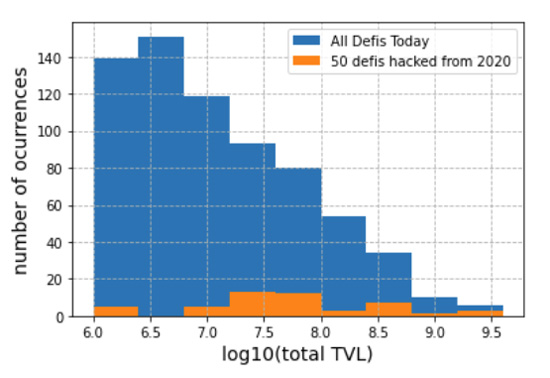
Figure 2: zoom in on the right side of Figure 1.
Now, dividing the number of hacks (orange bars in Figure 2) by the number of total DeFi protocols (blue bars in Figure 2), we estimate the probability distribution that a DeFi will be hacked according to its TVL value. An increasing relation can be noted in Figure 3.
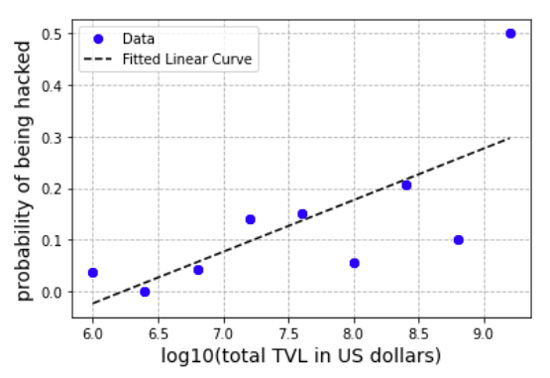
Figure 3: (blue dots) estimated probability distribution of being hacked for DeFi protocols with different TVLs; (black line) result of the linear regression model.
Performing a linear regression on this data we find a significant slope of 0.10 (black line, p-value = 0.03, r2 = 0.53). This means that, under a linear model, when a DeFi increases its value by a factor of 10, its probability of being hacked increases by 10%.
As stated in the Methods section, to check the robustness of this finding, we can estimate the TVL on the day of the incident for the 48 incidents listed in rekt news for which we don't have the TVL on the day of the incident by analyzing the relationship between the TVL on the day of the incident and the stolen amounts for the 50 incidents for which we do have the full data. This relationship can be observed in Figure 4 in a log-log scale. Performing a linear regression, whose line is also shown in Figure 4, we obtain a slope value of 0.72 (p-value < 0.0001), an intercept value of 2.7 (p-value 0.008), and an r-squared of 0.37.
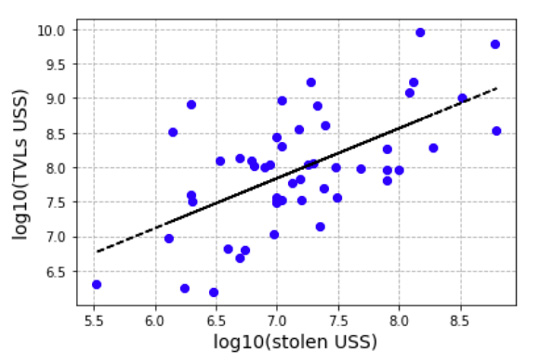
Figure 4: (blue dots) TVL on the day of the incident as a function of the stolen value for the 50 protocols we were able to collect the full data; (black line) results of a linear regression (slope = 0.75, p-value < 0.0001; intercept 2.6, p-value 0.014; r-squared 0.37)
Using the results of the regression shown in Figure 4, we estimated the TVL on the day of the incident for the 50 incidents for which we don't have this data. Then we performed the same analysis as before to calculate the probability of being hacked as a function of the TVL, but now taking into account the 98 incidents listed in rekt news: the 50 data points used to construct Figure 1 plus the 48 data points obtained using our estimation for the TVL on the day of the incident. Results are shown in Figure 5. The linear regression performed on these data results in an impressive r-squared value of 0.88. The slope of the regression is 0.13 (p-value 0.0002), meaning that when a DeFi increases its value by a factor of 10, its probability of being hacked increases by 13%.
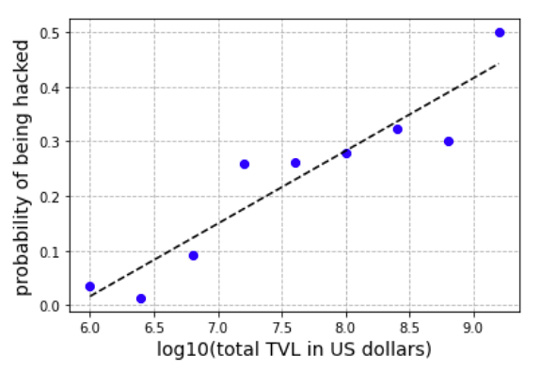
Figure 5: (blue dots) estimated probability distribution for DeFi protocols with different TVLs to be hacked, now considering all 98 DeFi protocols listed in rekt news. For those DeFi protocols for which we don't have the TVL on the day of the incident, we used the regression shown in Figure 4 to estimate it; (black line) result of the linear regression model (slope = 0.13). We found an impressive value for the r-squared of 0.88.
The results above depend of course on the step-size chosen to construct the histograms from which the probabilities are estimated. As stated before, we used a step-size of 0.4 in a log10 scale, which means that each bin of the histogram is centered at 10^0.4 ⋍ 2.5 times the center of the previous bin.
The selection of the step-size is based on two criteria. First, it must be large enough to avoid abnormal probabilities, since, if the step-size is too small, the TVL of a hacked DeFi may be in an interval that is not shared by the TVL of any other DeFi, and so the probability of being hacked for a DeFi with this particular TVL would be infinite. In our case this happens when we use step-sizes smaller than 0.1. Second, it must be small enough in order to have enough probability data points to infer significant relationships: in our case, if we use a step size of 0.5, for instance, we only have 7 probability data points and the linear regression using the TVL as independent variable and the probability of being hacked as the depend variable is no longer significant at a threshold level of 0.05.
In light of the above, we could use step-sizes larger than 0.1 and smaller than 0.5. We tested different step-sizes apart from 0.4 using the same data used to construct Figures 3 and 5, and the results were not qualitatively different from those shown above: it is a robust result that the probability of being hacked increases linearly with the log10 of the TVL market share of the DeFi.
Moreover, the cumulative probability distribution, which represents the probability that DeFi protocols with TVLs smaller than a certain number will be hacked, consistently shows a monotonic increasing behavior for TVL values larger than 10^6 independently of the used step-size, which can be observed in Figure 6, where we show the cumulative probability distribution using step-sizes of 0.2, 0.3, 0.4, and 0.5. It can be seen that the larger the TVLs included, the larger the probability of being hacked. When DeFi protocols of all sizes are included, the probability of being hack reaches a value of ⋍ 14%.
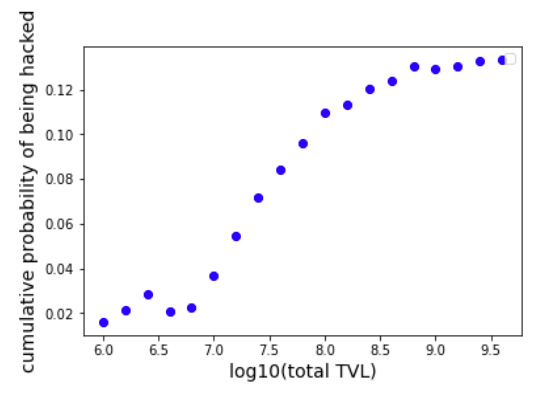
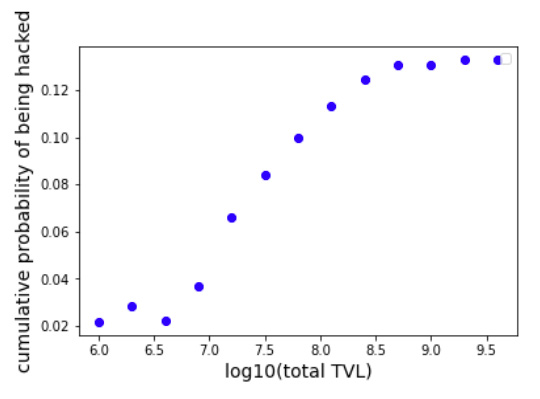
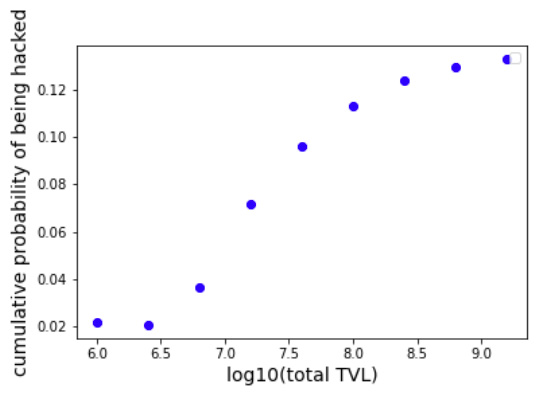
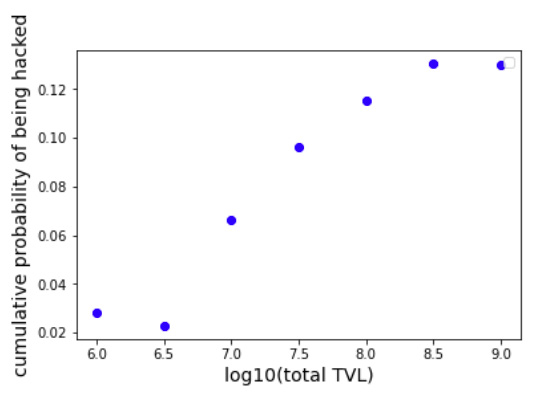
Figure 6: cumulative probability distribution of being hacked using histograms step-sizes of, from left to right, 0.2, 0.3, 0.4, and 0.5.
Discussion and conclusion
Methodologically, the main limitation of our study is that the results could change if the shape of the histogram representing the distribution of DeFi protocols with different TVL values, shown in blue in Figure 1, greatly changes with time. We don't know how the shape of this histogram was in 2020, for instance. But It seems reasonable to speculate that the shape was quite similar, with only one peak, a large amount of DeFi protocols with TVLs smaller than this peak, and a smaller amount of DeFi protocols with larger TVLs values.
The main conclusion of this article, shown in Figures 3 and 5, is that the probability that a DeFi protocol will be hacked increases with its TVL value.
The fact that the probability of a DeFi protocol being hacked increases with its TVL has dramatic consequences for policy makers and DeFi administrators, as it shows that current cybersecurity strategies used by these protocols are dramatically underestimating the risk of attacks for DeFi protocols with larger TVLs.
A recent study led by Klaus Grobys, from the University of Vaasa, Finland, titled “On the Tail Risk of Cyberattacks in the Bitcoin Market”, found similar results in the Bitcoin Market [Grobys, 2020]. They collected 53 hacking incidents during the 2011–2018 period and found that they follow a fat-tailed shape, and that, as a consequence, the probability of a large amount being stolen is much larger than if following a naïve statistic such as a gaussian shape. They even emphasize: “While the cyberattack on August 10, 2021 where hackers stole about $600 million in cryptocurrency came as a surprise and received enormous media coverage, this event is no surprise for our model”.
Together with our results, the results by Grobys suggest a phenomenon that can be extended to the crypto world more generally, not only to the Bitcoin market or to DeFi protocols. Even more, the boom that blockchain and DeFi technology experienced during the past few years presents an unusual opportunity to reflect upon and analyze the actual equilibria of the cyber attacker-defender game also in non-blockchain security protocols. It is an open question if the performance, expected probability of security incidents, and return on investment for cyber projects should in general be analyzed in light of these results.
References
Chainalysis, Defi Hacks Are on the Rise, 2022.
Chen, Yan, and Cristiano Bellavitis. "Blockchain disruption and decentralized finance: The rise of decentralized business models." Journal of Business Venturing Insights 13 (2020): e00151.
Grobys, K., Dufitinema, J., & Sapkota, N. (2020). On the tail risk of cyberattacks in the Bitcoin market. Available at SSRN 3733810.
Grobys, K. (2021). When the blockchain does not block: on hackings and uncertainty in the cryptocurrency market. Quantitative Finance, 21(8), 1267-1279.
Meyer, E., Welpe, I. M., & Sandner, P. G. (2021). Decentralized finance—a systematic literature review and research directions. Available at SSRN 4016507.
Uno.Reinsure, A Case Study of DeFi Hacks in Q1 2022 | by Uno.Reinsure
Zetzsche, Dirk A., Douglas W. Arner, and Ross P. Buckley. "Decentralized finance." Journal of Financial Regulation 6.2 (2020): 172-203.
Zhou, L., Xiong, X., Ernstberger, J., Chaliasos, S., Wang, Z., Wang, Y., ... & Gervais, A. (2022). SoK: Decentralized Finance (DeFi) Incidents. arXiv preprint arXiv:2208.13035.